
Luxury Furniture Retailer Grows Organic Revenue 42% and Paid Search Revenue 104% With a Full-Funnel Strategy
The Challenge
A luxury furniture and interior design retailer — selling online nationwide with a local showroom presence — came to us after more than a year with a large, well-known SEO agency that had delivered flat results. Beyond the lack of traction, the content strategy fundamentally missed the brand: the previous agency was publishing blog content around affordable furniture for apartment dwellers, when the retailer's actual audience is luxury interior designers and high-end residential shoppers.
We took over SEO first, then took over Google Ads management several months later. The goal across both channels was the same: realign strategy with who this brand actually sells to, and turn search — organic and paid — into a real, scalable, higher-value revenue channel rather than a flat line on a report.
What We Did
SEO Strategy:
Conducted a full audit of the existing SEO and content strategy, including brand-fit review
Rebuilt the content strategy around the brand's actual audience — luxury design-intent topics like quiet luxury, warm minimalism, and elevated interior styling
Prioritized and optimized collection and product pages across Furniture, Mirrors, Decor, Lighting, Outdoor, Bath, and Rugs on a phased, category-by-category basis
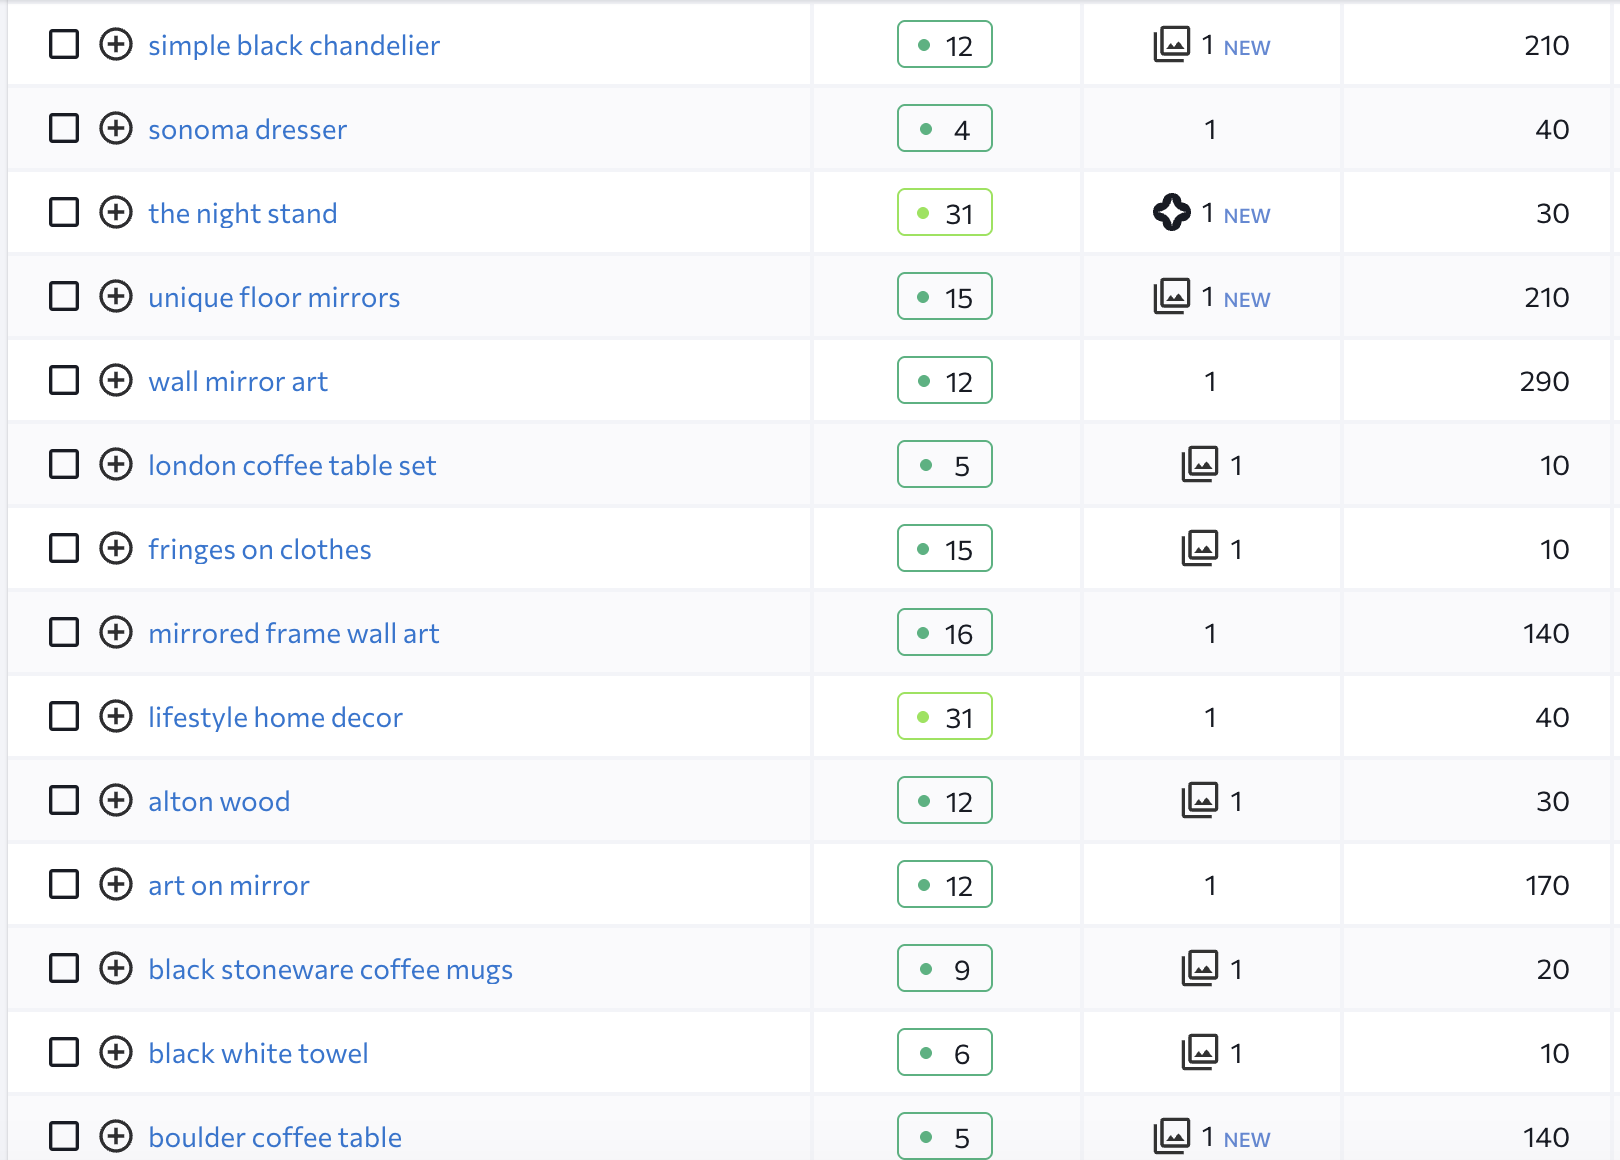
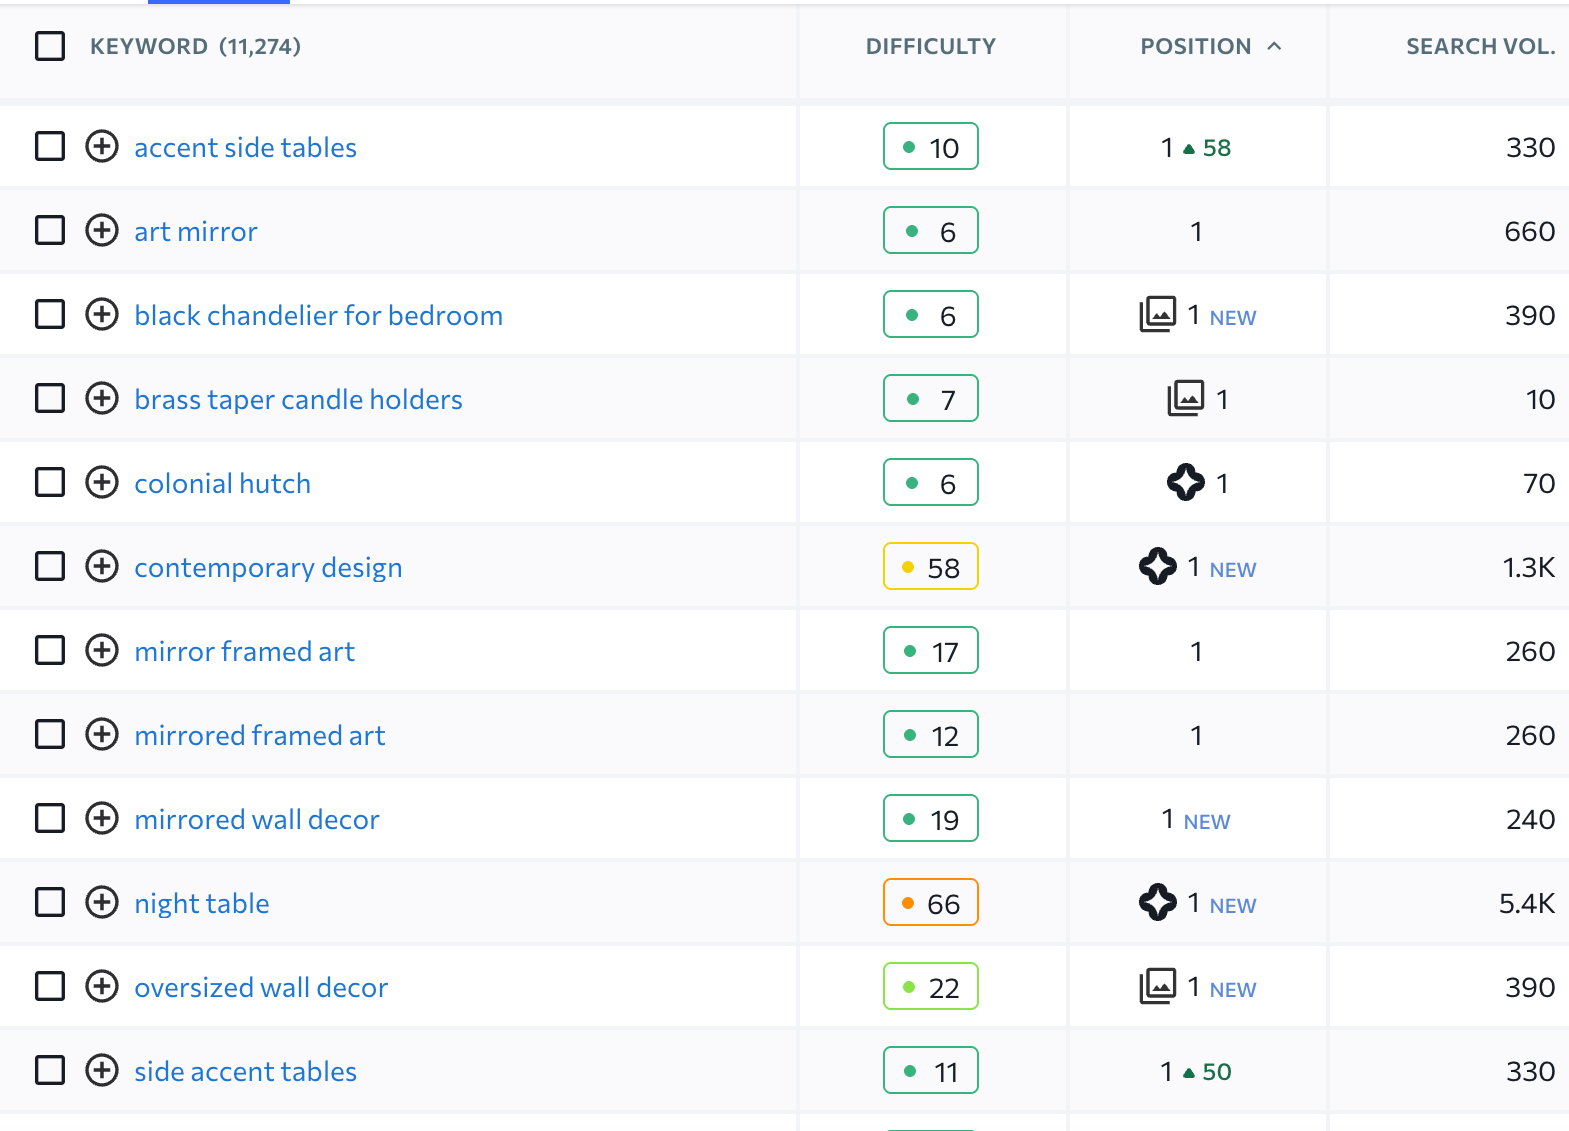
Targeted non-branded, product- and category-level search terms to grow discovery beyond existing brand demand
Published new blog content designed to support topical authority and AI Overview visibility
Monitored keyword rankings, non-branded visibility, and AI Overview presence monthly, adjusting priorities as categories matured
Paid Search Strategy:
Took over management of an existing Performance Max and Brand Search account
Reviewed and cleaned up purchase conversion tracking to ensure campaigns optimized toward the ecommerce actions that mattered most
Refined Brand Search keywords based on actual customer search behavior
Regularly refreshed sitelinks, callouts, structured snippets, and creative around launches and seasonal campaign.
Gradually scaled budgets as performance and confidence in the account grew
Launched Standard Shopping as an additional channel to diversify the campaign mix
Layered in third-party attribution reporting to validate Google's reported revenue against actual Shopify sales
Organic Search Results
(March–June 2026 vs. November 2025–February 2026)
42% increase in organic search revenue ($89,271 → $126,679)
116% increase in organic average order value ($335.60 → $723.88)
Organic share of total ecommerce revenue grew from 10.93% to 14.52%, peaking at 18.19% in June
130% increase in non-branded search impressions (739K → 1.7M)
40% increase in non-branded organic clicks (1,607 → 2,244)
Average non-branded search position improved by nearly 11 positions (22.0 → 11.4)
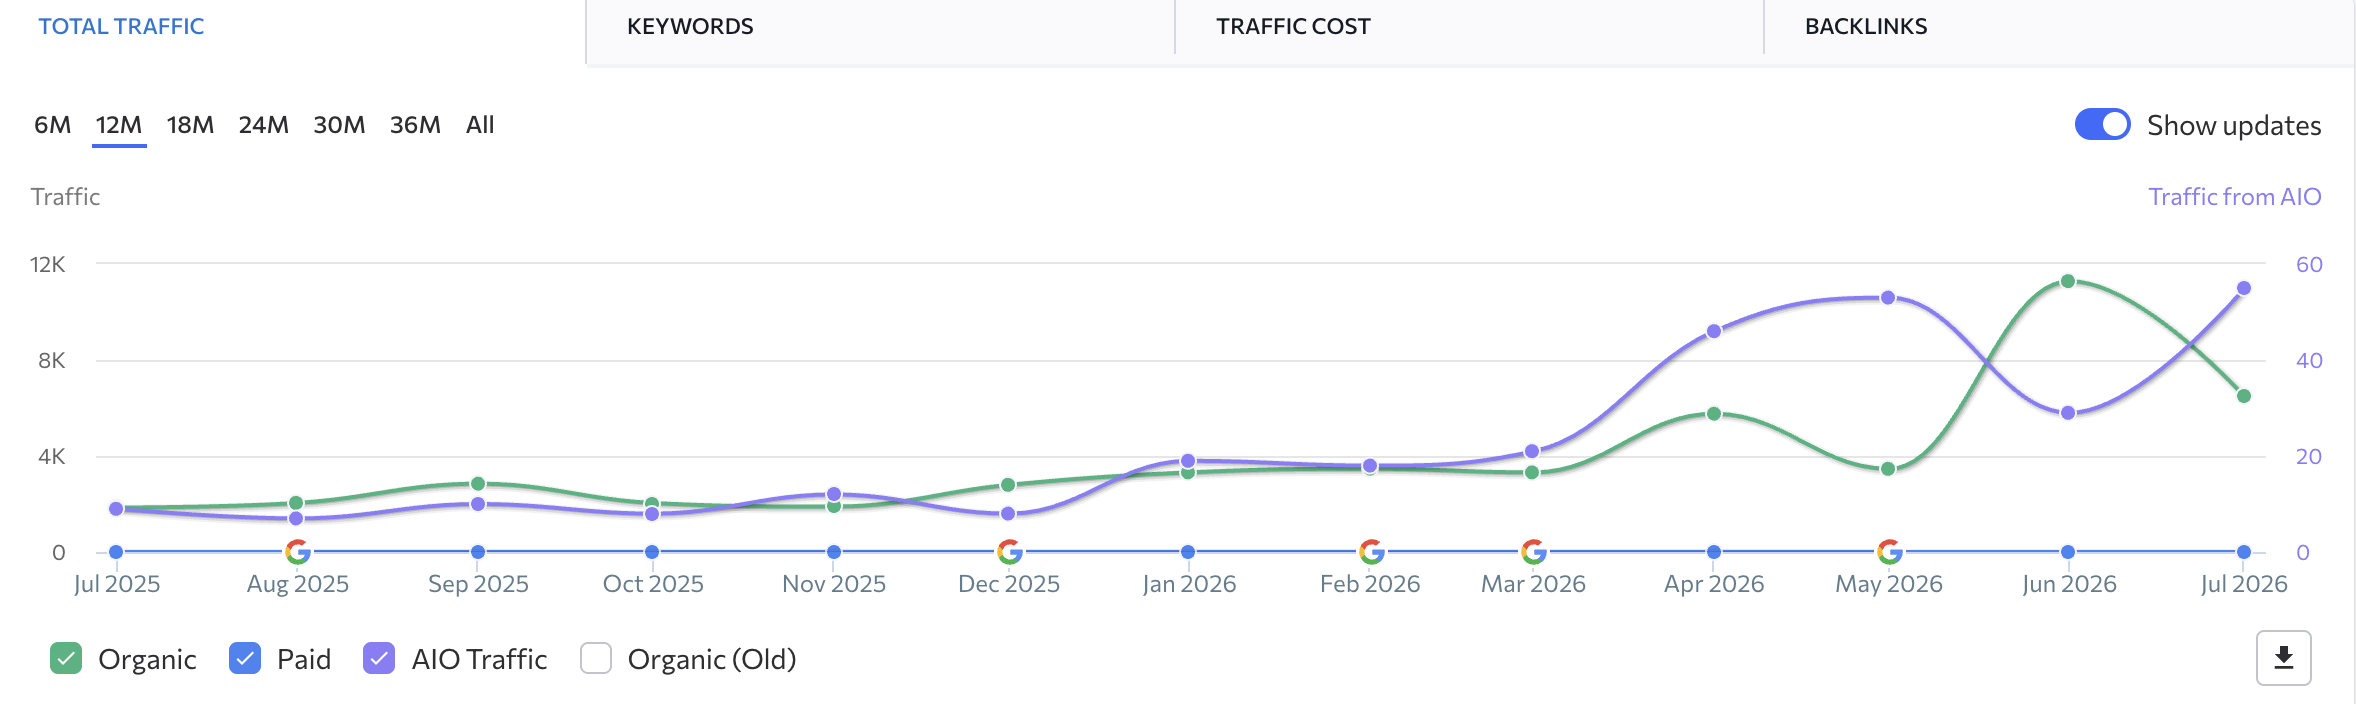
Doubled AI Overview (AIO) visibility within the first 3 months of the engagement, driven by the new brand-aligned blog content and optimized collection pages
One standout keyword win: "coffee table" moved from an average position of 84.65 to 7.69, driving 157 clicks and nearly 297,000 impressions in the engagement period alone. Category-level gains were led by Furniture and Mirrors — non-branded clicks to furniture pages more than doubled, and mirror-related pages saw non-branded impressions grow by over 236,000.
Notably, this growth in visibility and revenue came from a smaller volume of organic sessions, meaning the traffic that did convert was significantly higher-intent and higher-value than before. The retailer also discontinued a clothing product line during this period, which contributes to some of the session and transaction decline independent of the SEO strategy — making the AOV growth even more notable, since it wasn't inflated by a wider product mix.
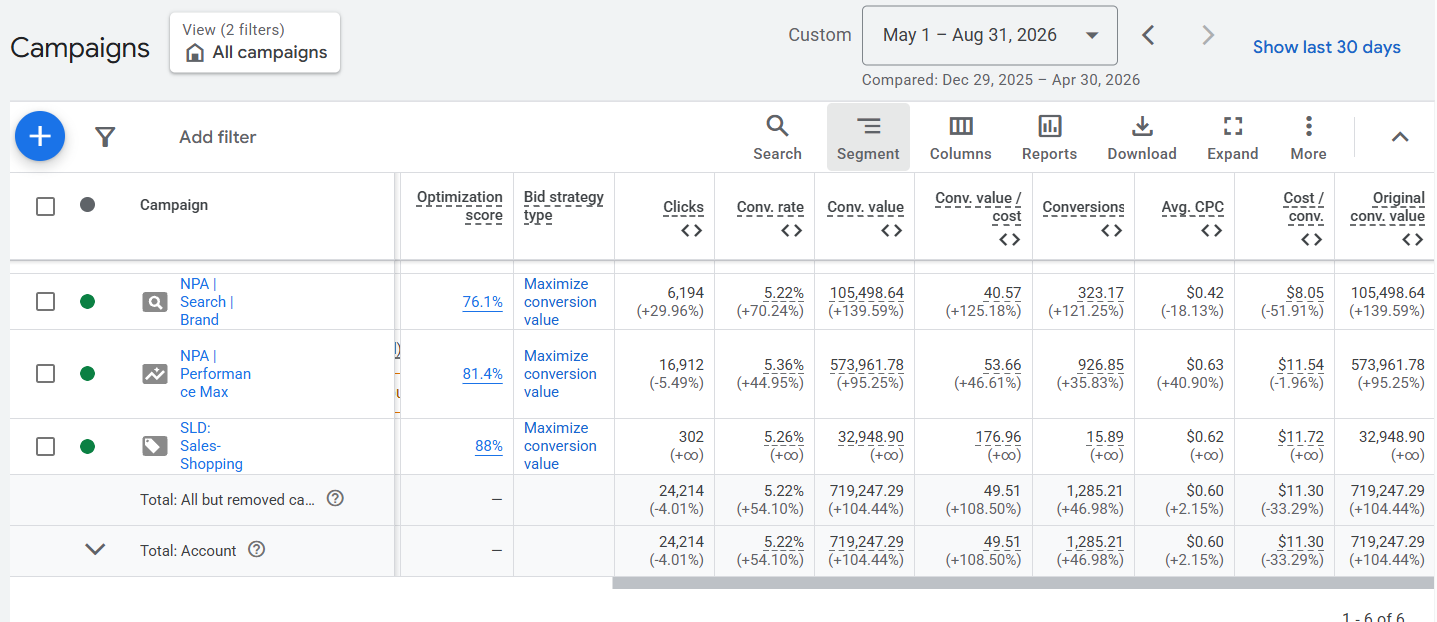
Paid Search Results
(May–August 2026 vs. December 2025–April 2026)
104% increase in Google Ads conversion value (more than $719,000 in tracked conversion value)
47% increase in conversions (1,285 total)
108% increase in ROAS, reaching 49.51x
33% decrease in cost per conversion (down to $11.30)
54% increase in conversion rate (5.22%)
Clicks actually decreased 4% — proof the account got more efficient, not just bigger
Performance Max remained the primary revenue driver, generating roughly $574,000 in conversion value at a 53.66x ROAS, with Brand Search contributing another ~$105,000 at a 40.57x ROAS. A newly launched Standard Shopping campaign added early incremental revenue while the team gathered performance data to scale it further.
Third-party attribution reporting introduced in July also showed a strong 6.74x revenue-to-spend ratio on Shopify sales tied to paid traffic — a separate methodology from Google's own reporting, but directional confirmation that the paid growth was translating into real ecommerce revenue.
Key Takeaway
Technical execution only works if it's built around who the brand is actually trying to reach. The previous agency's content wasn't wrong in a vacuum — it was wrong for this brand's audience. By rebuilding the organic content and category strategy around the retailer's real customer, and then bringing the same disciplined, conversion-focused approach to paid search, we turned a year of flat results into a full-funnel growth story: stronger organic revenue and order values, a fast-growing footprint in AI-driven search, and a paid search account that scaled spend while getting more efficient, not less.
Ready to see what's possible for your business?